whole system mapping
Exercise
 Time Estimate: 2—4 hours
There are four steps in the Whole System Mapping design method:
- Step 1: Visually map the product’s (or service’s) system.
- Step 2: Use estimated life cycle assessment (LCA) to set environmental priorities, then balance with business or other priorities.
- Step 3: Brainstorm on the system map you created (helps ideation be more thorough and radical).
- Step 4: Choose winning idea(s) based on your priorities and your estimates of idea performance.
Step 1: Create a whole system map of your product
 Time Estimate: 30—60 minutes
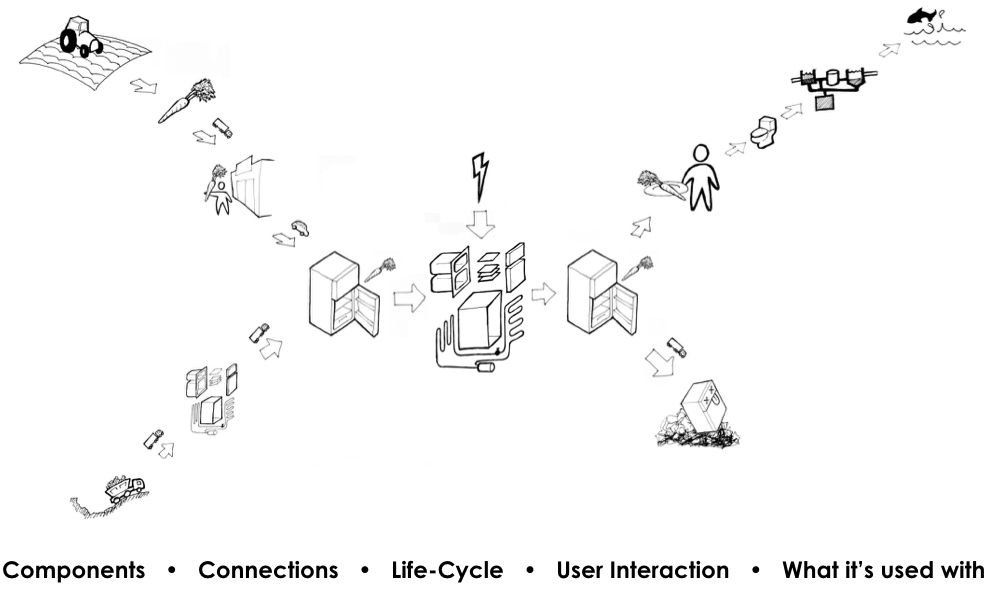
Sketch a mind-map of your product’s (or service’s) whole system. The map needs to include the following features:
- The product’s major components and how they connect (a full Bill of Materials, or at least major subassemblies; if a service or digital product, what hardware is used?)
- The product’s full life cycle (Raw material, manufacturing, transport, use, disposal).
- When / why / how the user uses the product or service.
- How the system’s nodes are connected–lines or arrows to show the flow of time or material or logic.
- If other products or infrastructure are always used with your product or service (like clothes for a dryer, or roads for a car), include them in the map, too.
Post-it notes on a whiteboard or big sheet of paper are best, so that you can move things around as you build the map. Below is an example system map for a refrigerator drawn on paper:
Image Credit: Faludi MCAD Class (2010)
Step 2: Set priorities based on LCA & business
 Time Estimate: 5—10 minutes
To set priorities, quantitatively measure the biggest opportunities to improve your product. This exercise uses a basic estimated life cycle assessment (LCA). Learning LCA takes time, so here are some alternatives:
- Find an existing relevant LCA, such as those at ProductDesign.green.
- Use the mini-LCA quiz to get some ideas about types of metrics you might track
- Explore certification systems (like Cradle to Cradle or EPEAT)
- Use one of the graphs below to fake it for this exercise
To save time and concentrate on this design method, choose the product category closest to yours in the graphs below, and use it to find your top sustainability priority. (Each graph below is a rule-of-thumb for general categories of products; for precision decisions, use an LCA for your actual product.) For example, the refrigerator above would be in the “large electrical” category, so its top priority would be energy use during its life. For this and your own estimated LCAs, remember they will always have large uncertainties, so you should only trust large differences in scores.
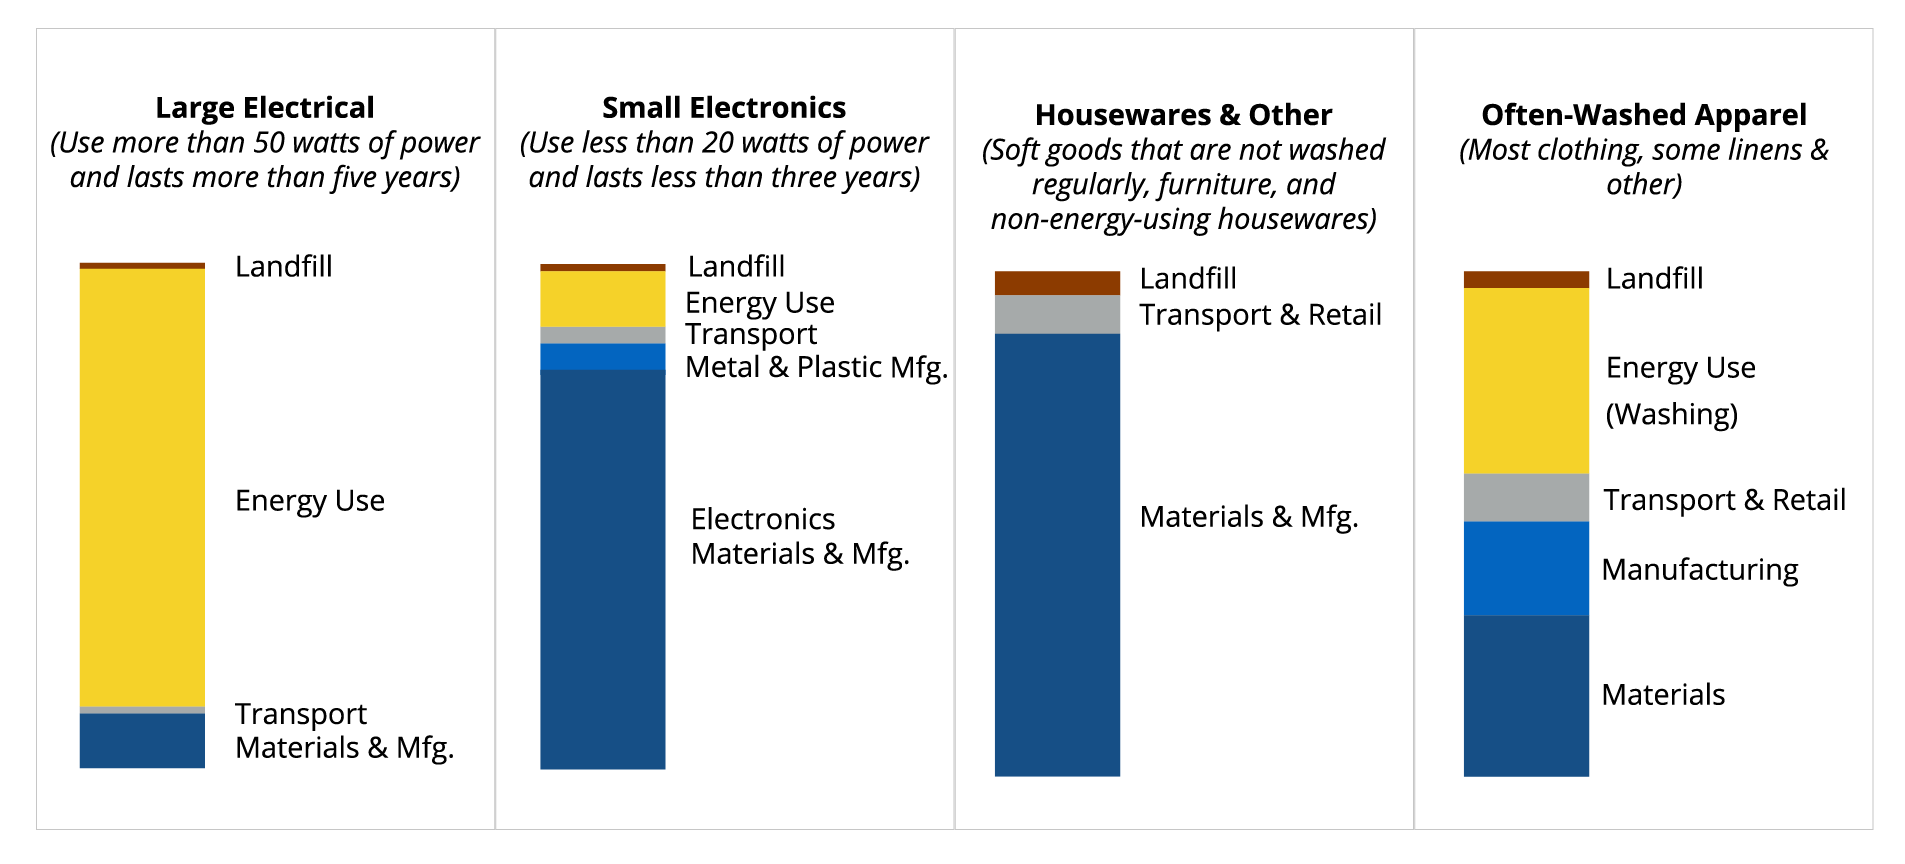
Image Credit: Faludi MCAD Class (2014). More pre-calculated LCAs available at ProductDesign.green.
Given your estimated LCA, first write down your top environmental problem to focus on. You may also write down a top social sustainability problem to focus on, if you know one. Second, write down one or two non-sustainability business priorities (e.g. price, necessary features, etc.). Clearly number the priorities in order of importance. You may list more sustainability and business priorities, but 2 to 4 priorities keeps it simple.
Step 3: Brainstorm solutions on your system map
 Time Estimate: 20—40 minutes
Now this is the fun part! Brainstorm on your Whole System Map from Step 1, to solve your top priority. For example, if your LCA shows that your product’s energy use causes the most environmental damage and your business prioritizes low cost and visual appeal, your brainstorm’s goal might be “Reduce lifetime energy impacts without compromising cost or aesthetics.”
Ideally, brainstorm using a different color of post-it than you did to make the system map, so you can tell your new ideas from the system components. Follow the rules of brainstorming to generate ideas: don’t say no to any ideas, but also stay focused on your topic.
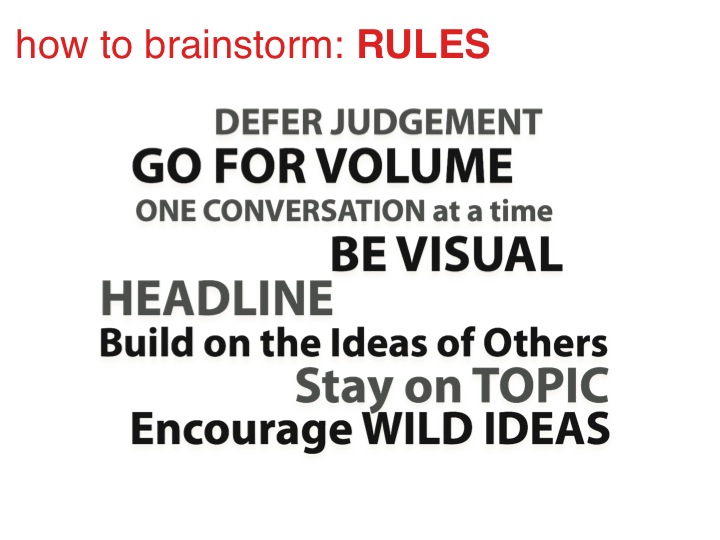
Image Credit: IDEO.com
Use the whole system map to:
A: Brainstorm at least one new idea for every node in the system map. A “node” can be any subassembly, component, or step in the process. (Every post-it.) You should have several ideas for each relevant node, and ideally one for every node, relevant or not! This gives you a more thorough brainstorm. For example, here’s a start for the refrigerator:
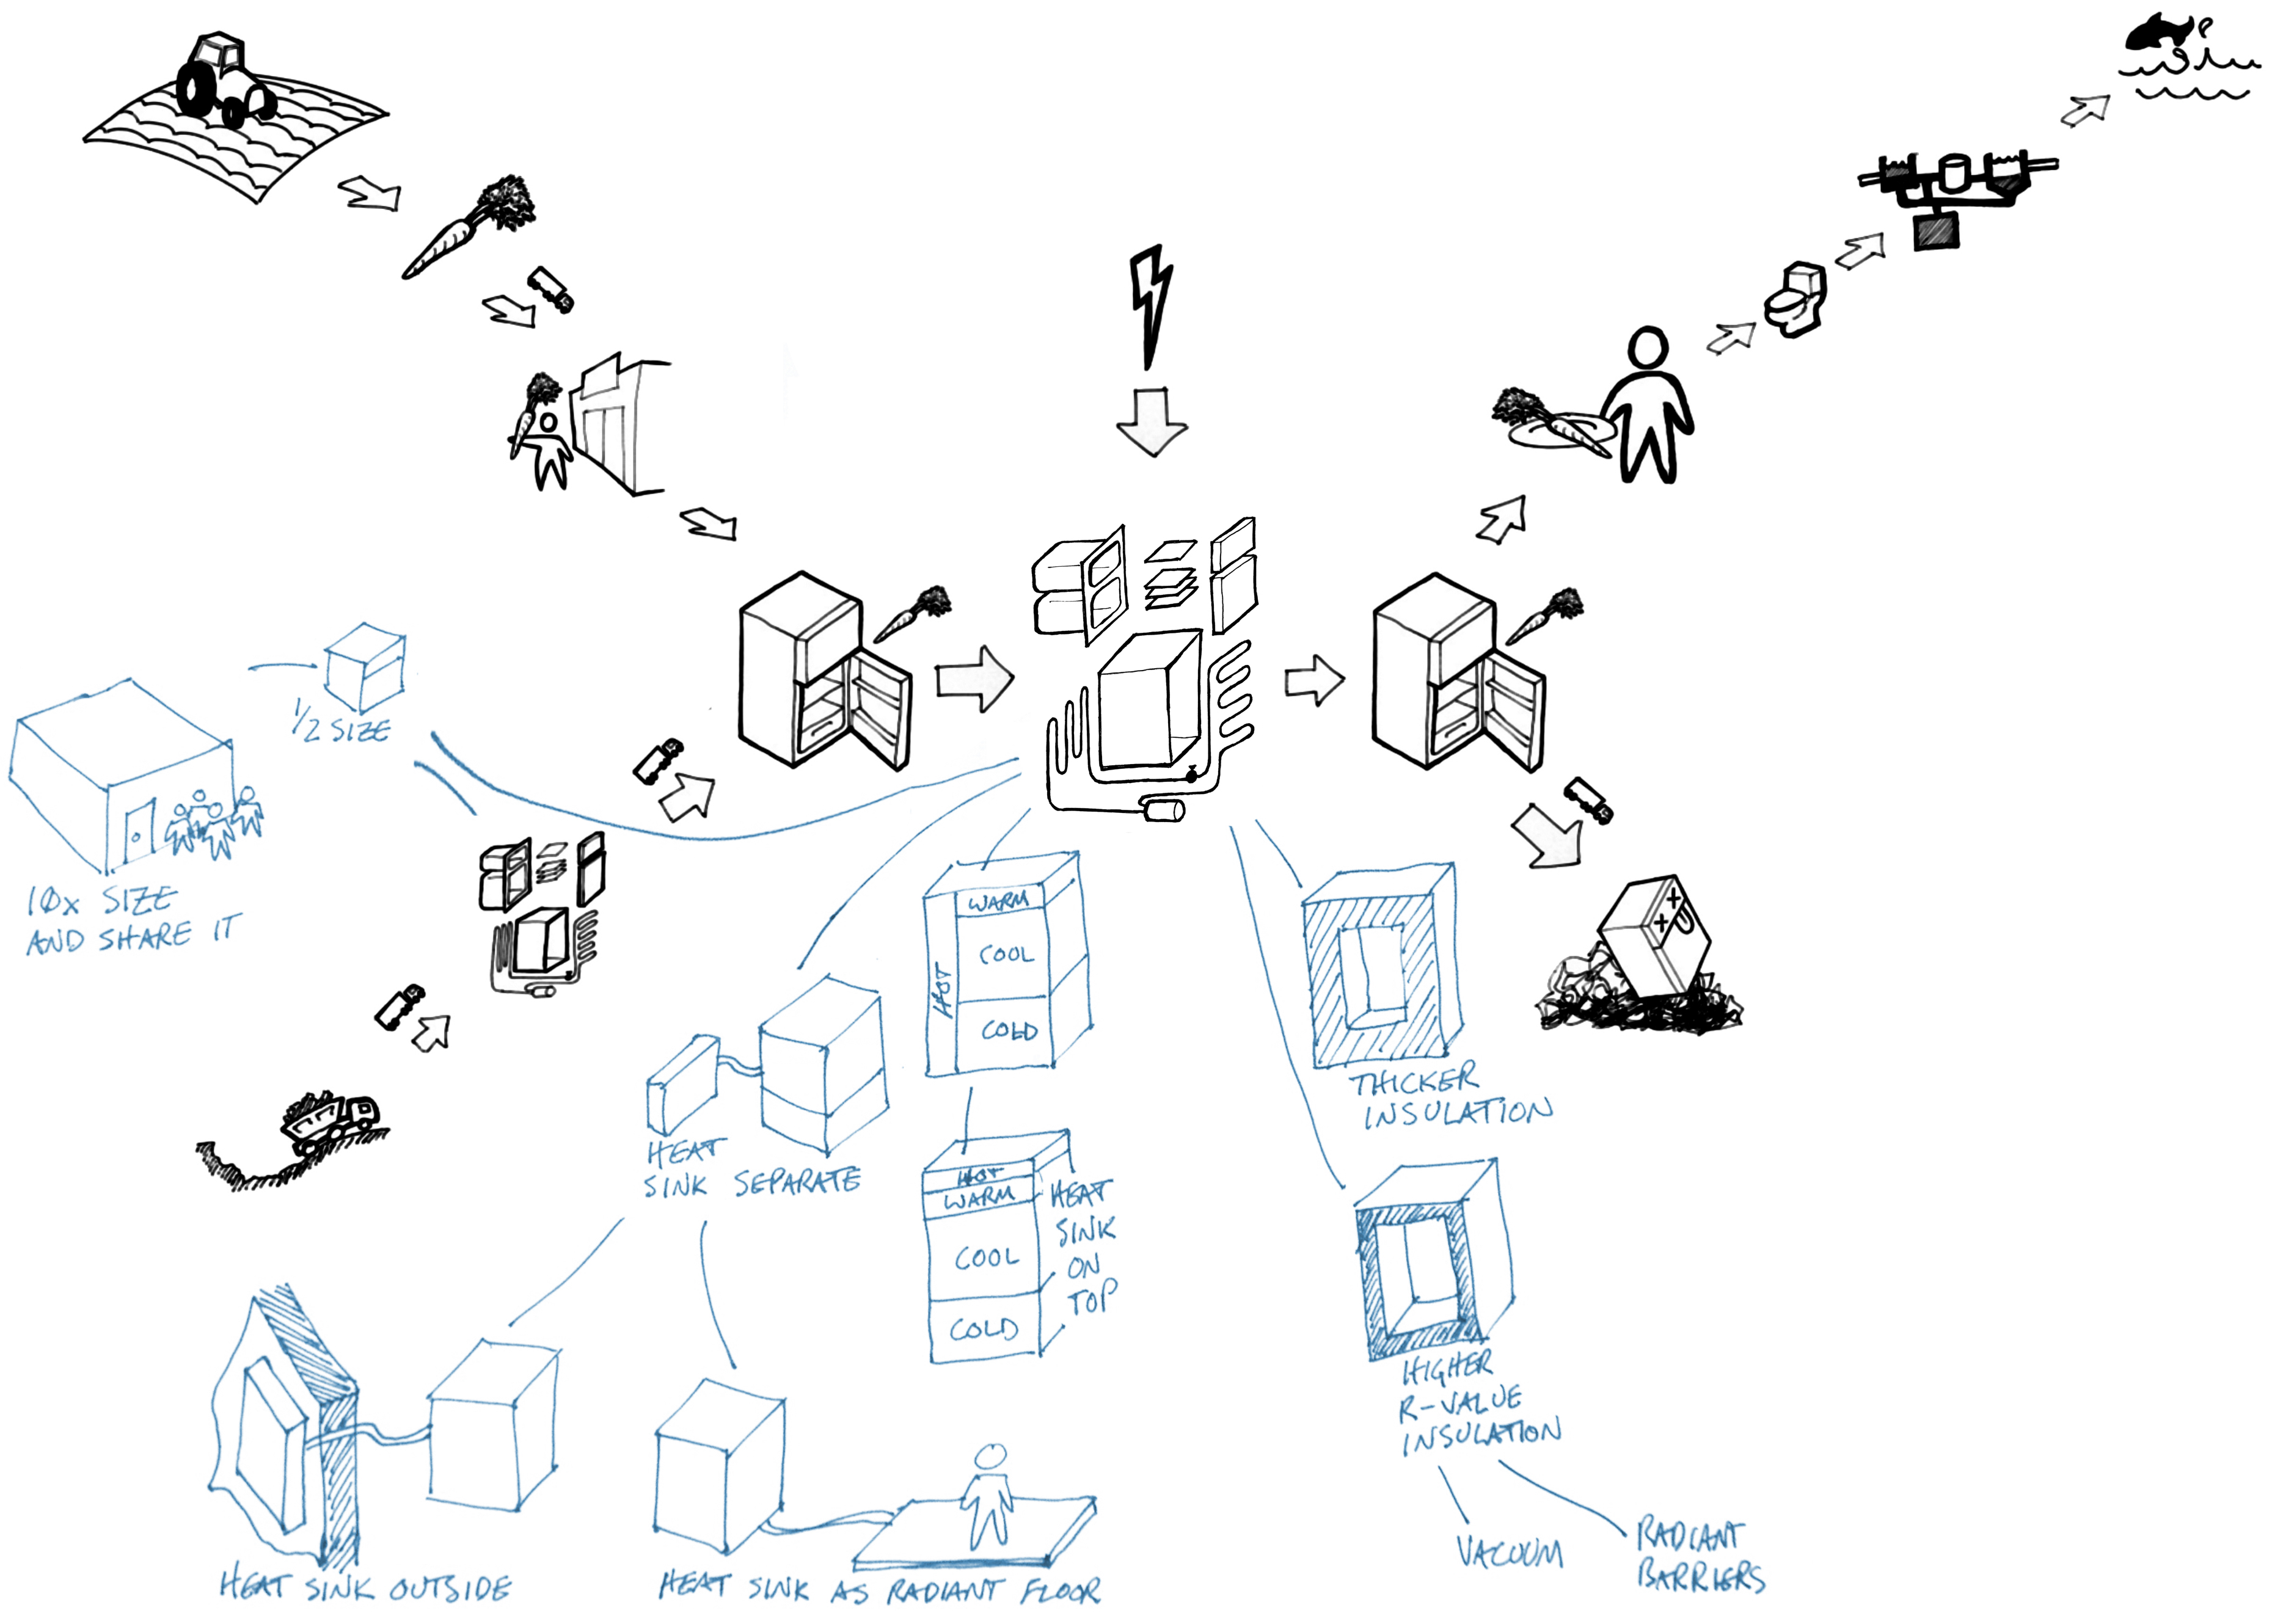 Image Credit: Faludi MCAD Class (2010)
All the ideas above relate to saving energy, because for the refrigerator, energy use is the biggest environmental impact. (We know this because it is categorized as a “large electrical” product in the LCA graphs above.) However, this brainstorm still needs ideas for raw materials, electricity, and other nodes in the system map.
B: Brainstorm ways to eliminate nodes in the system map. This process of elimination gives you more radical ideas: the more nodes you skip, the more radical the idea usually becomes. For example, the brainstorm below has several ideas eliminating the refrigerator entirely, and one idea eliminating the food supply chain. Generate at least five (ideally ten) ideas that skip nodes in the system.
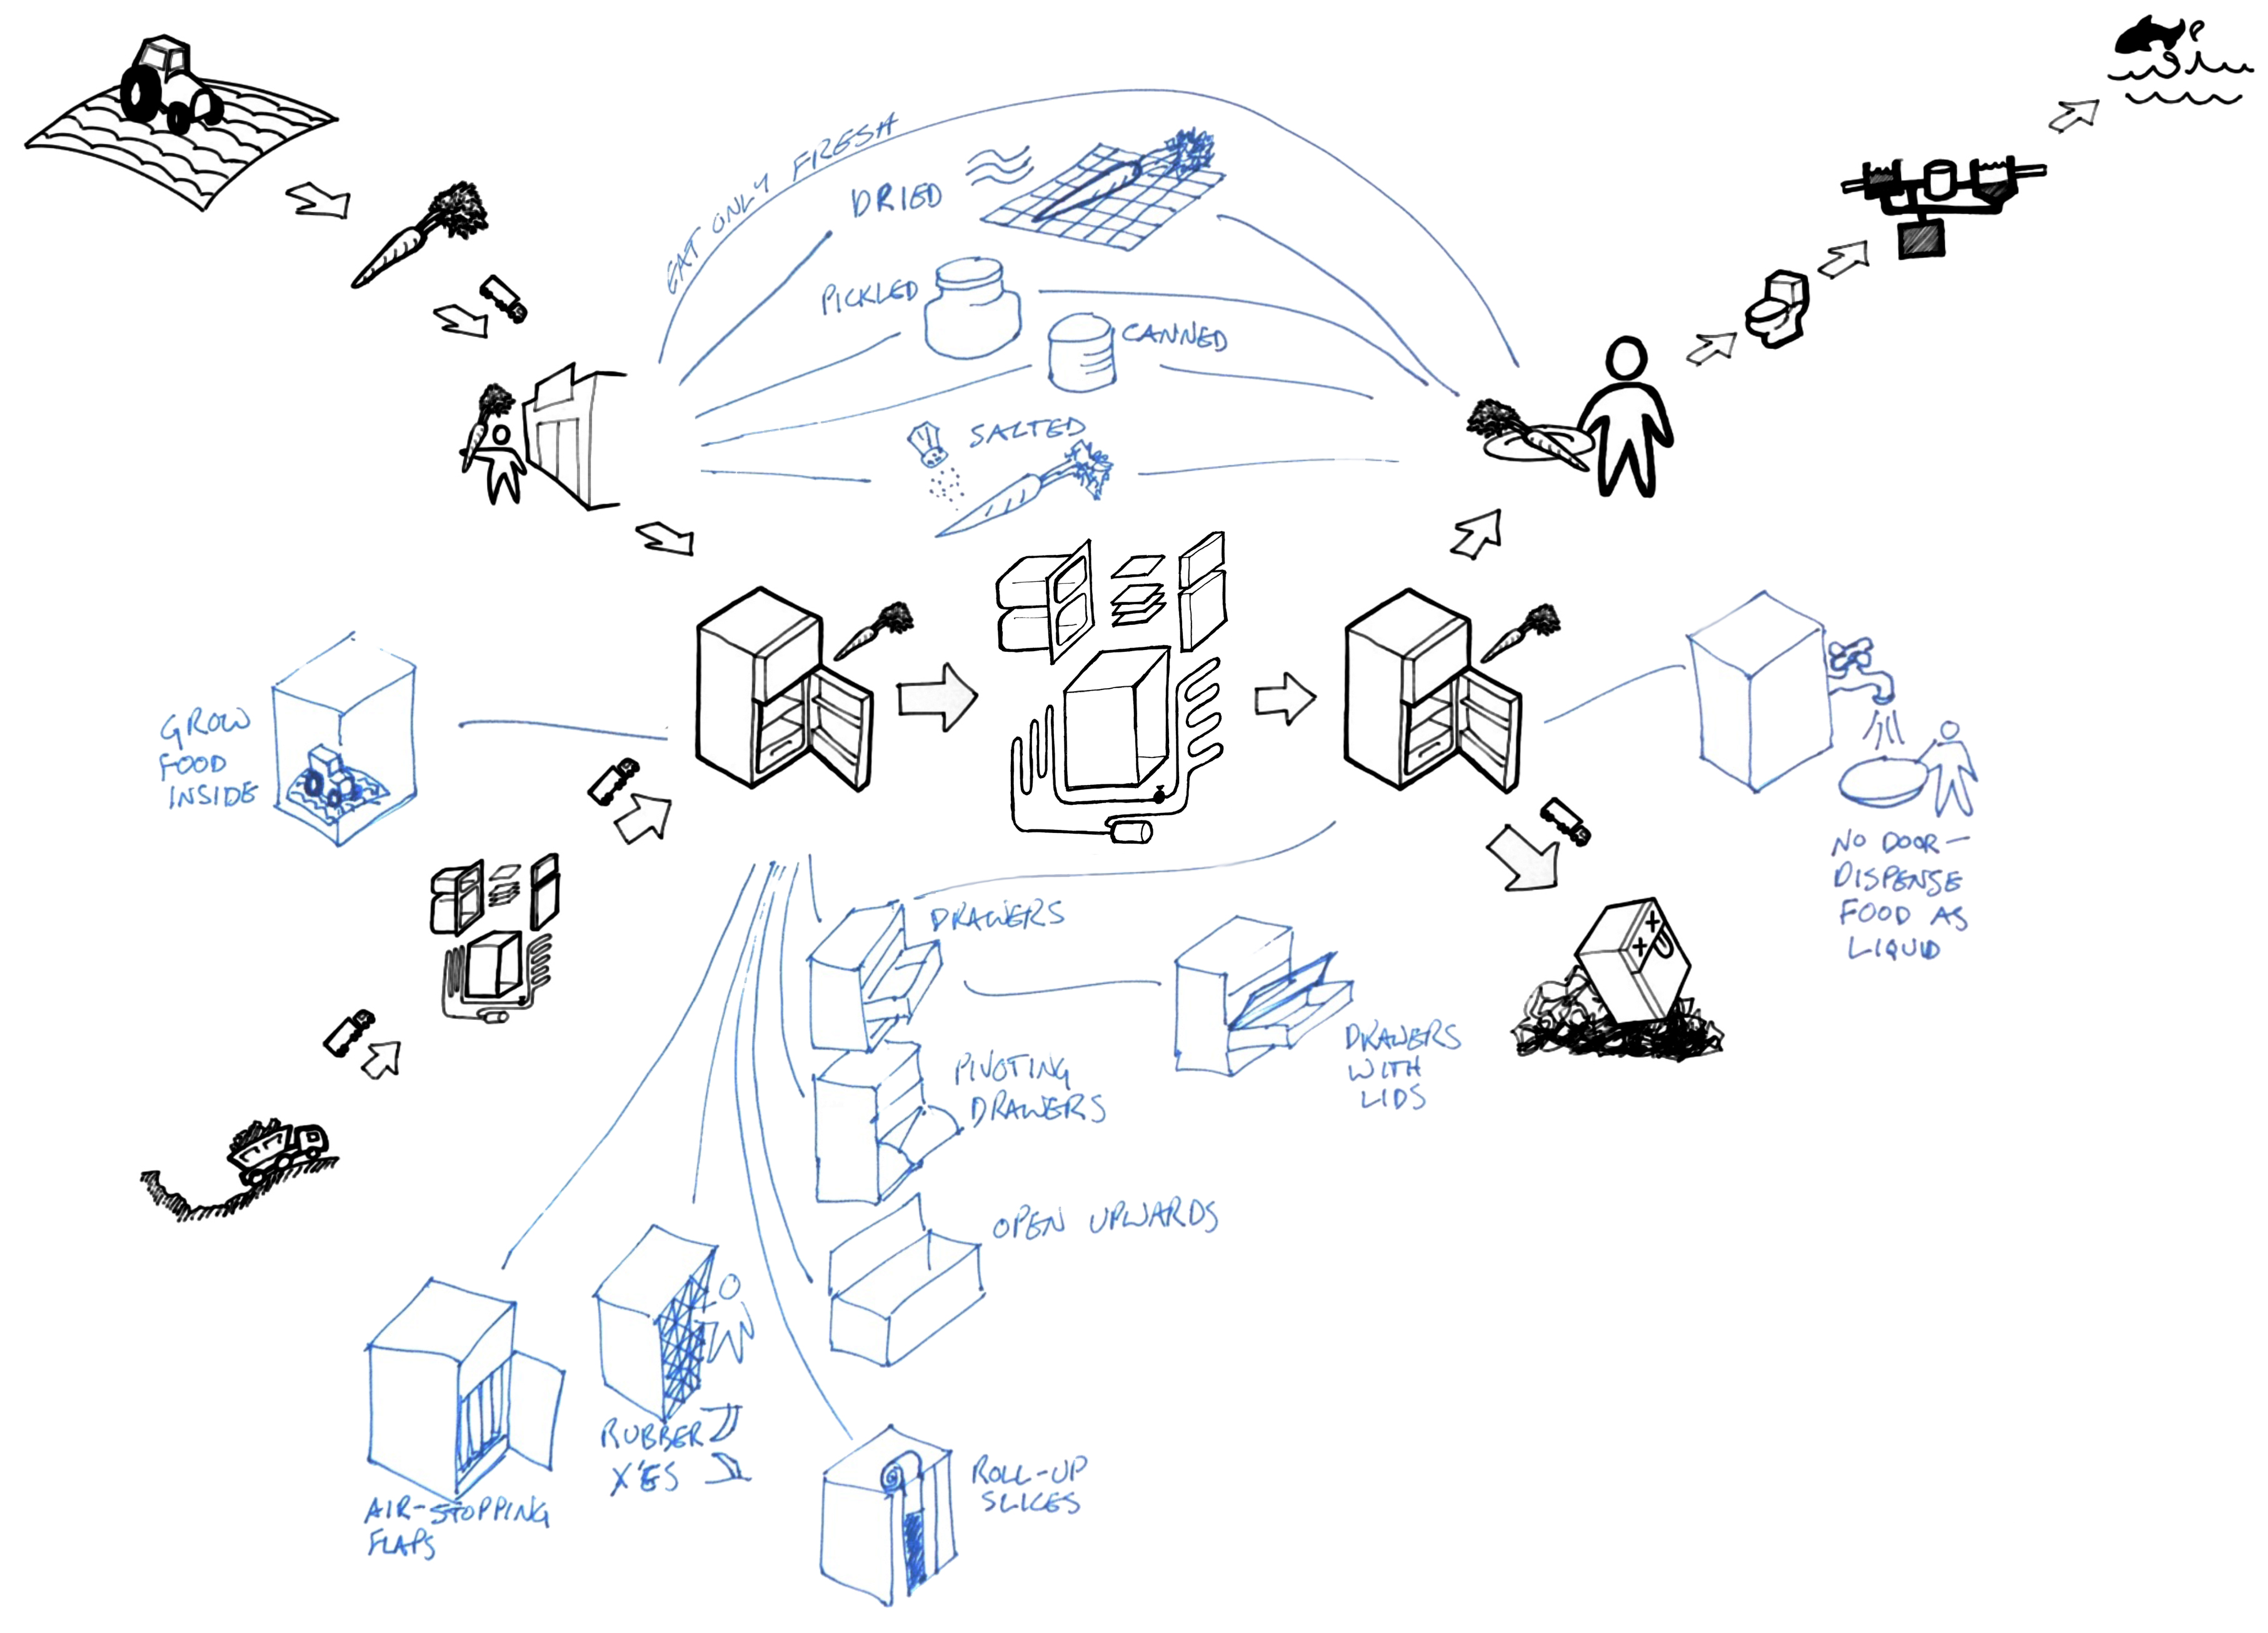
Image Credit: Faludi MCAD Class (2010)
If you want to get more advanced, you can integrate other systems-thinking methods into your brainstorm, or even use them to enhance your system map. Two particularly good ones are 12 Leverage Points by Donella Meadows and Factor Ten Engineering (10xE) by Rocky Mountain Institute.
Step 4: Choose winning idea based on your priorities
 Time Estimate: 10—40 minutes
Take your brainstormed list of ideas and narrow it down to 5-8 best options, considering what would best accomplish the priorities and delight users.
Then measure each of your top options against your Step 2 top priorities for sustainability and business. If you have LCA skills, do an estimated LCA on each. (Remember these results will have huge uncertainties, so only trust huge improvements!) In choosing your final winner, balance sustainability and business priorities. One good way is to make a decision matrix like this:
In this decision matrix, each column is one of your new ideas and each row is one of your design priorities. (You might even add a row for “general awesomeness” to capture inspiring factors your design priorities miss.) You can download this Excel file to do the math for you, if you like. Score each option from 1 (bad) to 5 (best). Then multiply that score by the weight of how important that objective is, from 1 (don’t really care) to 5 (top priority), and add up all the weighted scores. In the table above, Option #3 wins.
This process involves lots of guesswork—that’s why the decision matrix is valuable. It helps you juggle many guesses at the same time. You can use a different way of deciding on the winning idea, instead of a decision matrix. You can also combine ideas or decide to pursue multiple ideas. But don’t use intuition alone, use real analysis/estimation of each top option’s performance versus your design priorities.
Now that you’ve finished the whole design method, you should have a clearer idea of the problem(s) you’re solving and their context, a clearer set of priorities, lots of new ideas, and a decision of what to pursue further.
Checklist for Self-Assessment
To score your success on this exercise, see if you…
- Illustrated all the product’s major components / subassemblies and how they are connected.
- Illustrated the product’s whole life-cycle.
- Illustrated when/why the user uses the product or service.
- Illustrated what other things are always used with it.
- Illustrated the system with visual clarity (ideally even aesthetically).
- Quantitatively estimated the top sustainability priority (using LCA or other scorecard).
- Listed the top sustainability priority with business priorities, in order of importance.
- Generated new ideas for every node in the system map.
- Generated new ideas that eliminate nodes from the system map.
- Quantitatively estimated how well the new ideas achieve your listed priorities.
- Decided on idea(s) to move forward with.
All VentureWell Tools for Design and Sustainability content is shareable and usable by CC BY-NC-SA 4.0 license.
