measuring sustainability
Exercise
Life-Cycle Assessment (LCA)
 Time Estimate: 3—8 hours
 Goal: Estimate an LCA of your product, to find priorities for sustainability and make fair comparisons between alternatives.
Step 1: Decide on your scope (boundaries) and functional units
Time Estimate: 10—30 minutes
- Every LCA needs a goal. This LCA’s goal is to quickly estimate priorities for eco-design.
- Choose your scope — the boundaries of what you will and won’t consider in your analyses. Ideally you would choose everything in your Whole System Map, but you might exclude things out of your control, or too peripheral to the system.
- Choose the functional units for your analysis (e.g. environmental impact per hour of operation, or impact per kilo of food cooled, etc.). If you consider multiple scenarios, this must be consistent between them all.
Note: Choose the functional unit well, because it affects your final conclusions. A comparison of a disposable paper coffee cup and a ceramic mug would favor the disposable cup if the functional unit were environmental impact per cup, because one paper cup requires less material and energy and produces less waste. However, a comparison would favor the ceramic mug if the unit were environmental impact per liter of coffee drunk, because the mug’s impacts get amortized away over dozens or hundreds of liters of coffee drunk. SustainableMinds has a good tutorial page on choosing functional units well.
Step 2: List your inventory
Time Estimate: 1—5 hours
- Make a table of your invention’s Bill of Materials (BOM) and manufacturing methods as best you can: how many grams of this material, formed with what manufacturing method, how many pounds of that material, everything. Also include an estimate of energy use during product lifetime, transportation from the manufacturing site to end consumer, and disposal scenario—everything that was within the boundaries you set above. (For example, here is a table for a common refrigerator, and the LCA analysis for the refrigerator).
If your business is a service, make a table of the energy use, transportation, and other things that will be caused by people using your service and performing it.
Step 3: Calculate impacts and consider scenarios for sensitivity analysis
Time Estimate: 1—3 hours
- Enter all of the data above into this template calculator spreadsheet.
- You may not know which materials to choose from the LCA software database or lookup table (for example, there are several kinds of steel, which have very different impacts). You can try to look up these materials online, using Google searches or material databases, or you can just guess and include a large uncertainty or run multiple scenarios for best-case and worst-case alternatives.
- You likely won’t find all the right materials in the database. Make your best guess about what an equivalent proxy would be, or by assembling a proxy out of several items (e.g. you might estimate a motor with a certain amount of forged steel, copper drawn into wire, and magnets.) Your estimates may be wrong, but leaving out components means you think they have zero impact. If you include your large uncertainties in the analysis, you can see whether you need more precision, or if the impacts are small enough that it wouldn’t change the final overall result.
- Consider a few different scenarios, to explore where your assumptions might be wrong—particularly when you estimated materials or processes that weren’t in the database. Write down best-case and worst-case values for things you’re uncertain of (like energy use, or key material sizes or types). This is called “sensitivity analysis” because it shows how sensitive your results are to changes in assumptions. These may cause you to rethink your boundaries or functional unit; that’s ok, even encouraged.
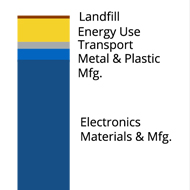
- When you have entered all the data, you can graph the results.
Step 4: Interpret results
Time Estimate: 5—15 minutes
- Look at the graphs for your different scenarios with different assumptions. What do you see? What parts of your system have the biggest impacts? What impacts change the most with different assumptions?
- Interpreting your graphs may cause you to rethink your boundaries or functional unit; that’s ok, you can redo them and make new graphs to interpret. Don’t expect it to be a linear process.
- Use your final interpretations to estimate your priorities for eco-design. Where should you focus your creative efforts? Where do you need to know more before moving ahead?
Checklist for Self-Assessment
To score your success on this exercise, see if you…
- Listed scope: what you did and didn’t consider in your analyses.
- Listed functional units to fairly compare scenarios.
- Built system inventory table with Bill of Materials (BOM) including their masses & manufacturing methods, energy use during product life, transportation, and disposal scenario (whatever was within your scope.)
- Performed sensitivity analysis of at least two or three different scenarios for materials, use, etc.
- Graphed results from LCA software or your own hand-calculations, and labeled graphs with their impact units (for example, kg CO2 equivalents, ReCiPe Endpoint H points, Okala points, etc.)
- Wrote brief (50 – 200 word) interpretation of the results: what are the biggest impacts per functional unit? What are the biggest uncertainties? Should the functional units or scope be changed? What does it all mean for your design priorities?
All VentureWell Tools for Design and Sustainability content is shareable and usable by CC BY-NC-SA 4.0 license.